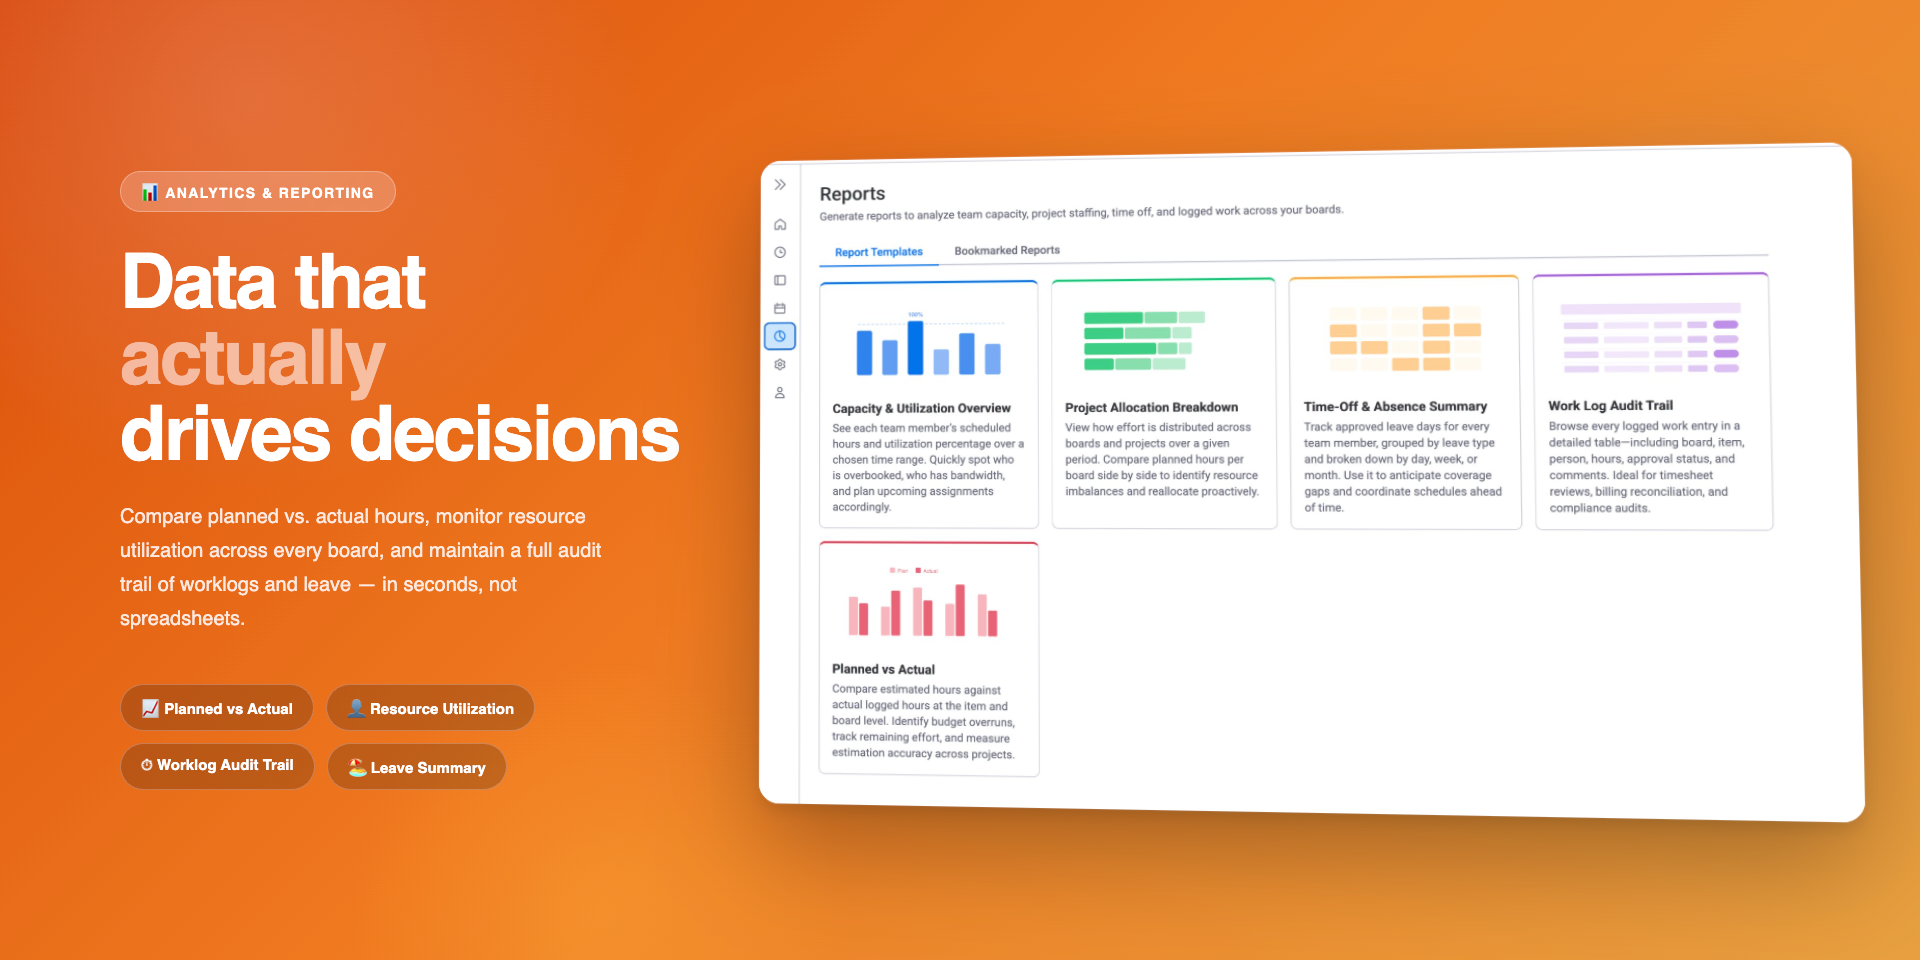
Overview
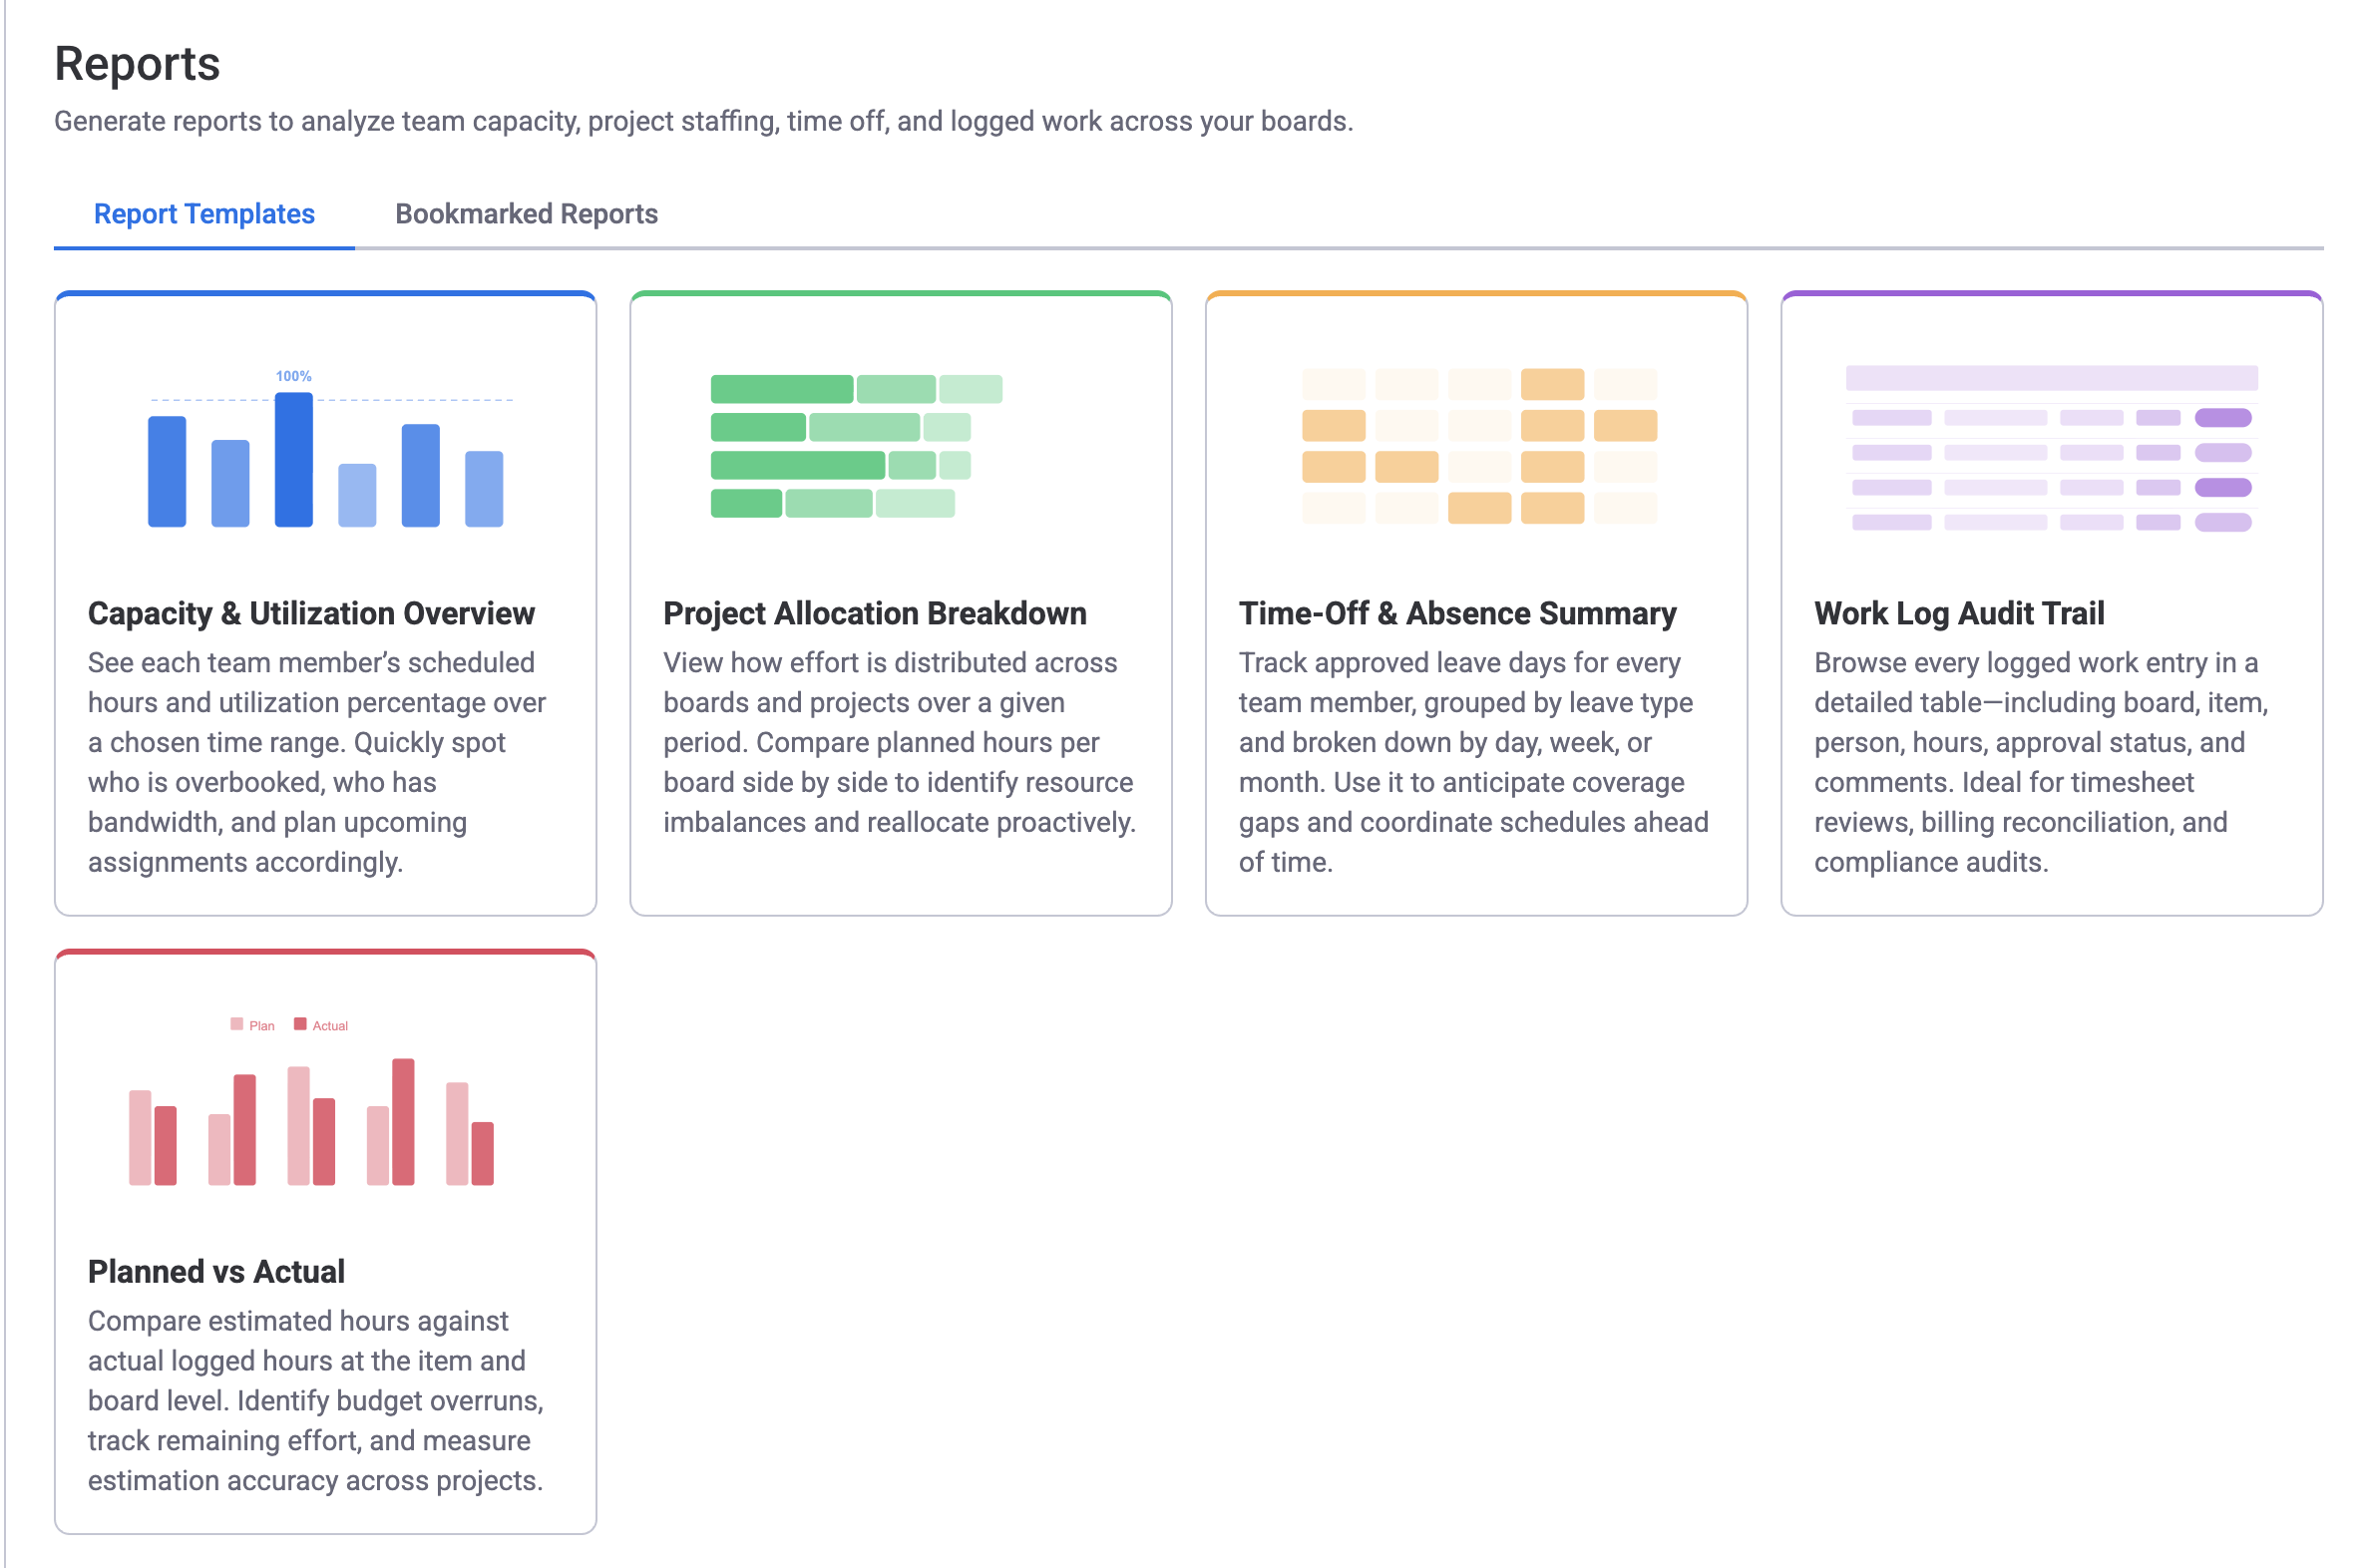
The Reports module lives in the Workspace View and gives you five ready-made report templates. Each template answers a different question about your team's time, capacity, or project progress. You can filter results, bookmark configurations you use often, and export any report to Excel.
Open the app in Workspace View and click Reports in the left sidebar. You will see two tabs:
- Report Templates — browse all five templates. Click a card to configure and generate a new report.
- Bookmarked Reports — your saved configurations. Click a bookmark to re-run the report instantly.
Report Types
1. Utilization Forecast
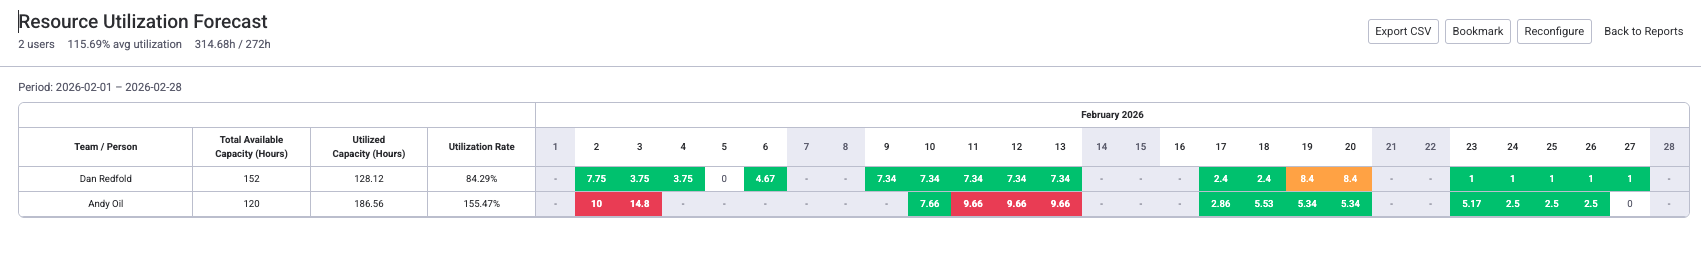
The Utilization Forecast shows each team member's remaining workload and utilization from today forward. It uses remaining estimates (Original Estimate minus logged worklogs) so you see real future load, not already-completed work. Past periods are excluded — the report focuses on what lies ahead.
Key columns
| Column | What it shows |
|---|---|
| Total Available | Working hours based on the user's capacity scheme, minus holidays and approved leave. |
| Utilized | Remaining estimated hours (Original Estimate minus logged worklogs) for future days. For Hours Per Day items, the daily rate is shown as-is. |
| Rate | Utilized divided by Total Available, shown as a percentage. Cells are color-coded: green for balanced, orange for warning (100-120%), and red for overloaded (above 120%). |
Grouping options
Use the Group by setting to organize results:
- None — a flat list of team members with utilization data across date columns.
- Team — members grouped by their monday.com team with team-level totals.
- Board — each person row expands to show per-board scheduled hours.
- Item — each person row expands to show per-item breakdowns.
2. Board Resources Forecast
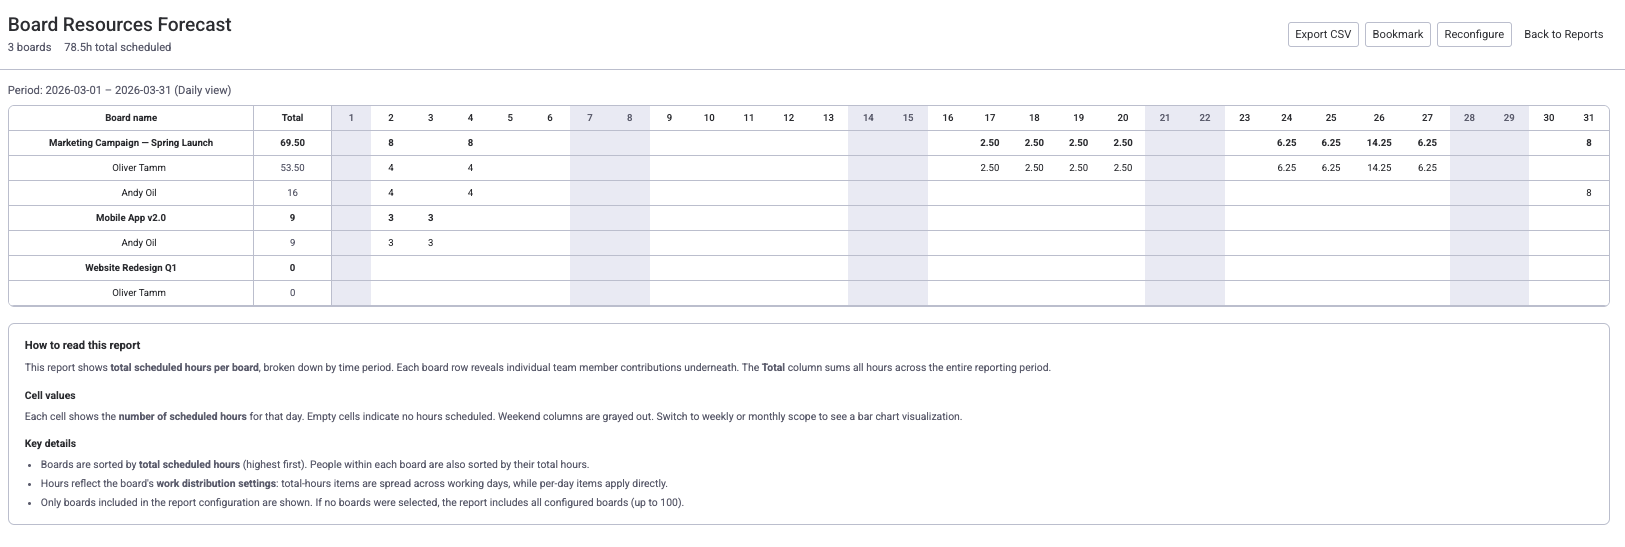
The Board Resources Forecast shows how remaining effort is distributed across your boards and projects from today forward. It uses remaining estimates (Original Estimate minus logged worklogs) to reflect real allocation, not already-completed work. Each board appears as a row with a total, and you can expand it to see per-person allocations broken down by day, week, or month. For actual logged time history, use the Detailed Worklog report.
Table structure
| Column | What it shows |
|---|---|
| Board Name | The monday.com board. Each row shows total scheduled hours across all assignees. |
| Person | Expandable sub-rows under each board showing per-person allocation. |
| Total | Sum of scheduled hours for the entire reporting period. |
| Date columns | Scheduled hours broken down by day, week, or month depending on the selected scope. |
3. Leave Report
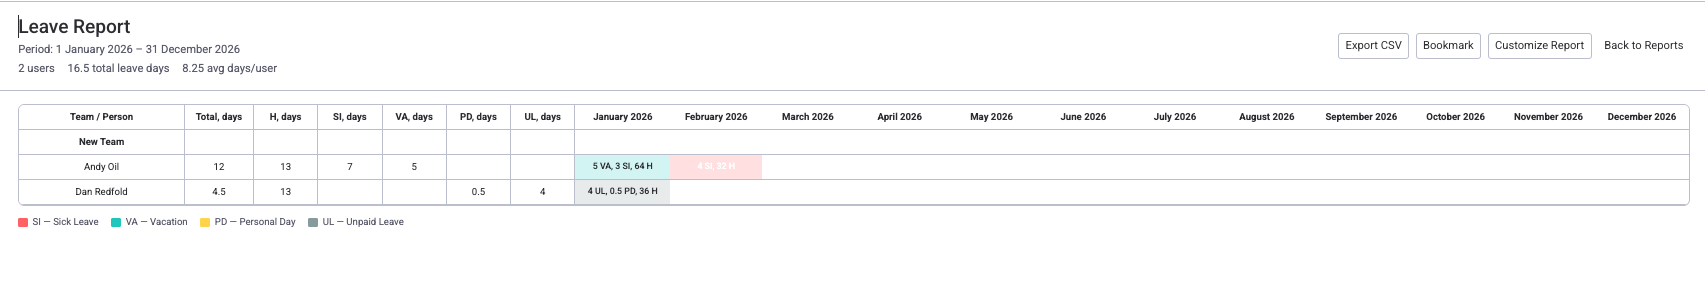
The Leave Report tracks approved leave days for every team member. It provides a timeline view with a breakdown by leave type, making it easy to plan around upcoming absences and spot coverage gaps.
Key columns
| Column | What it shows |
|---|---|
| Person | The team member's name. |
| Total | Total leave days taken across all types for the reporting period. |
| H (Holidays) | Holiday days from the user's assigned holiday scheme. |
| Leave type columns | One column per leave type (for example, AL for Annual Leave, SL for Sick Leave) showing total days. |
| Date columns | Leave days per day, week, or month depending on the selected scope. |
Use cases
- Coverage planning — identify upcoming gaps when multiple team members are off simultaneously.
- HR compliance — verify leave balances and track usage by type.
- Capacity forecasting — combine with the Utilization Forecast to see how leave impacts future capacity.
4. Detailed Worklog
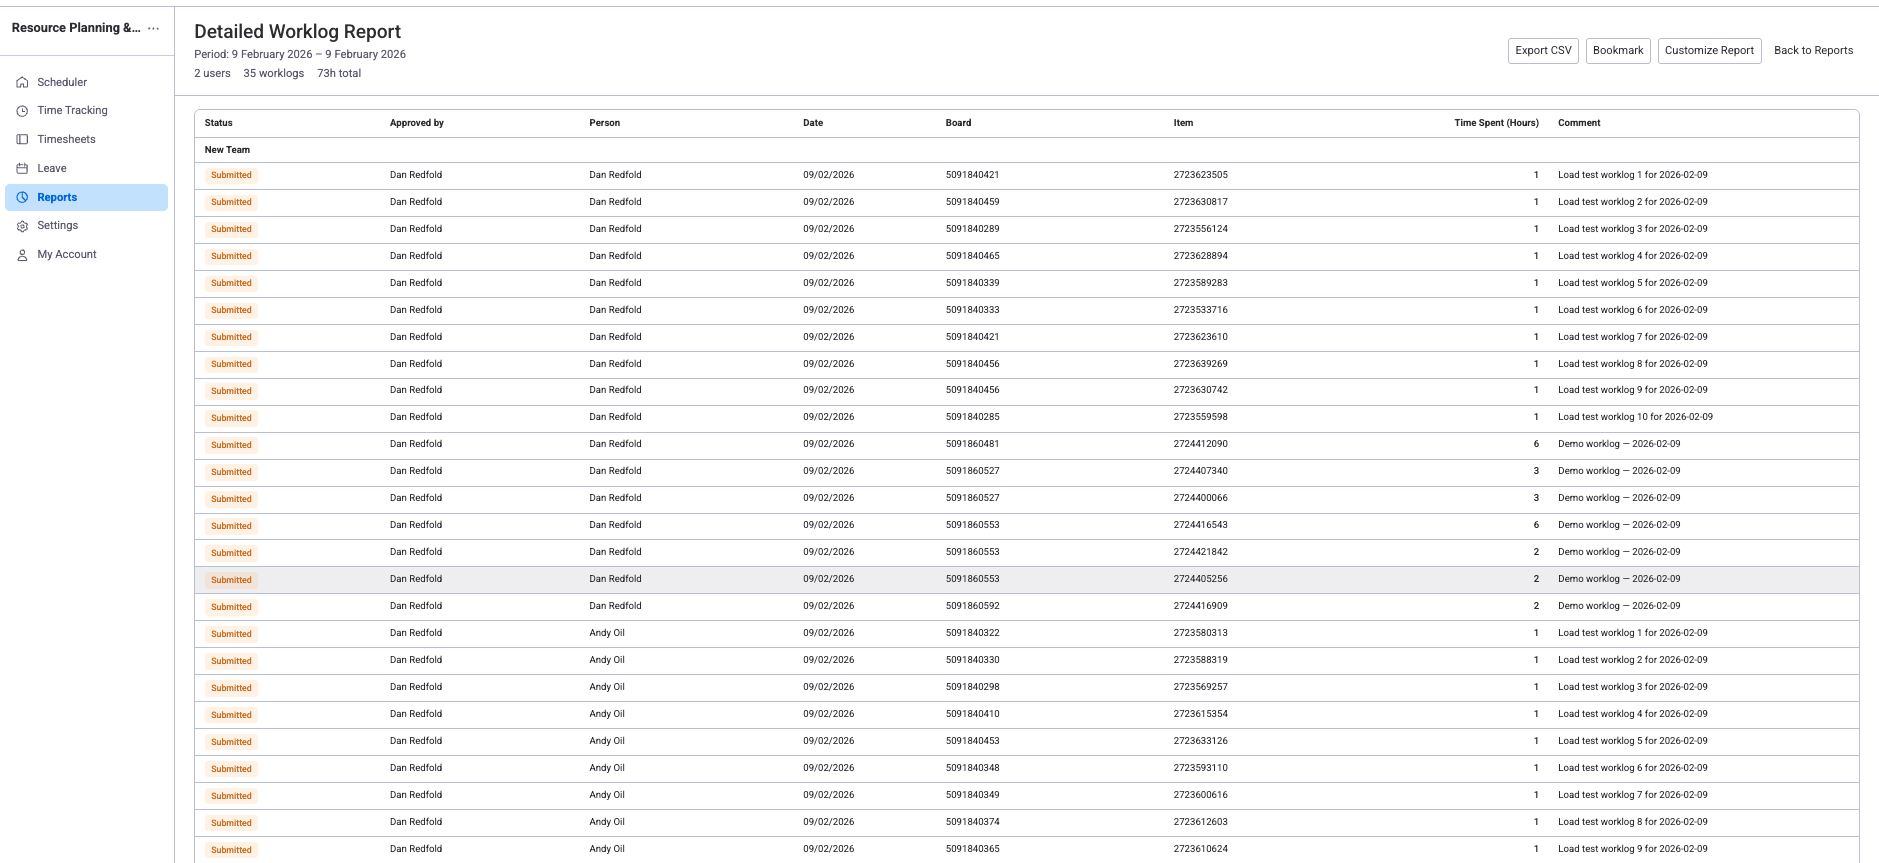
The Detailed Worklog lists every work log entry recorded through the time tracking module. It shows logged hours per user, per item, and per board, along with the timesheet approval status for each entry. This is the report to use for invoicing, payroll, and compliance audits.
Report columns
| Column | What it shows |
|---|---|
| Status | Timesheet approval status (Approved, Pending, or Rejected). Only shown when the timesheet Approval Workflow is enabled in Settings. |
| Approved by | The person who approved the timesheet for this entry's period, if applicable. Only shown when the timesheet Approval Workflow is enabled in Settings. |
| Person | The team member who logged the time. |
| Date | The date the work was performed. |
| Board | The board the item belongs to. |
| Item | The monday.com item the worklog is recorded against. |
| Category | The worklog category (billable or non-billable) selected when the time was logged. |
| Time Spent | Number of hours logged. |
| Comment | Optional note attached to the worklog entry. |
Filters and grouping
- Period — choose a preset (Current Month, Previous Month, Current Quarter, etc.) or set a custom date range.
- Teams — filter by one or more monday.com teams.
- People — filter by specific team members.
- Group by — organize rows under None, Board, Item, or Category headers. Excel exports respect the selected grouping.
Approval status values
These values and the Status / Approved by columns are only visible when the timesheet Approval Workflow is enabled in Settings. If approvals are turned off, the worklog report shows only Person, Date, Board, Item, Category, Time Spent, and Comment.
| Status | Meaning |
|---|---|
| Submitted | Timesheet submitted but not yet reviewed by the approver. |
| Closed (Approved) | Timesheet approved — worklogs are locked and cannot be edited. |
| Closed (Rejected) | Timesheet rejected — the user should correct entries and resubmit. |
| Reopened | A previously closed timesheet was reopened for edits. |
| — | No timesheet submitted for this period — worklog is unsubmitted. |
Use cases
- Payroll processing — export approved worklogs to Excel for payroll systems.
- Client invoicing — filter by board (project) and date range to get billable hours.
- Compliance audits — verify every worklog has an approval trail.
- Effort analysis — see exactly where each person spent their time.
5. Planned vs Actual
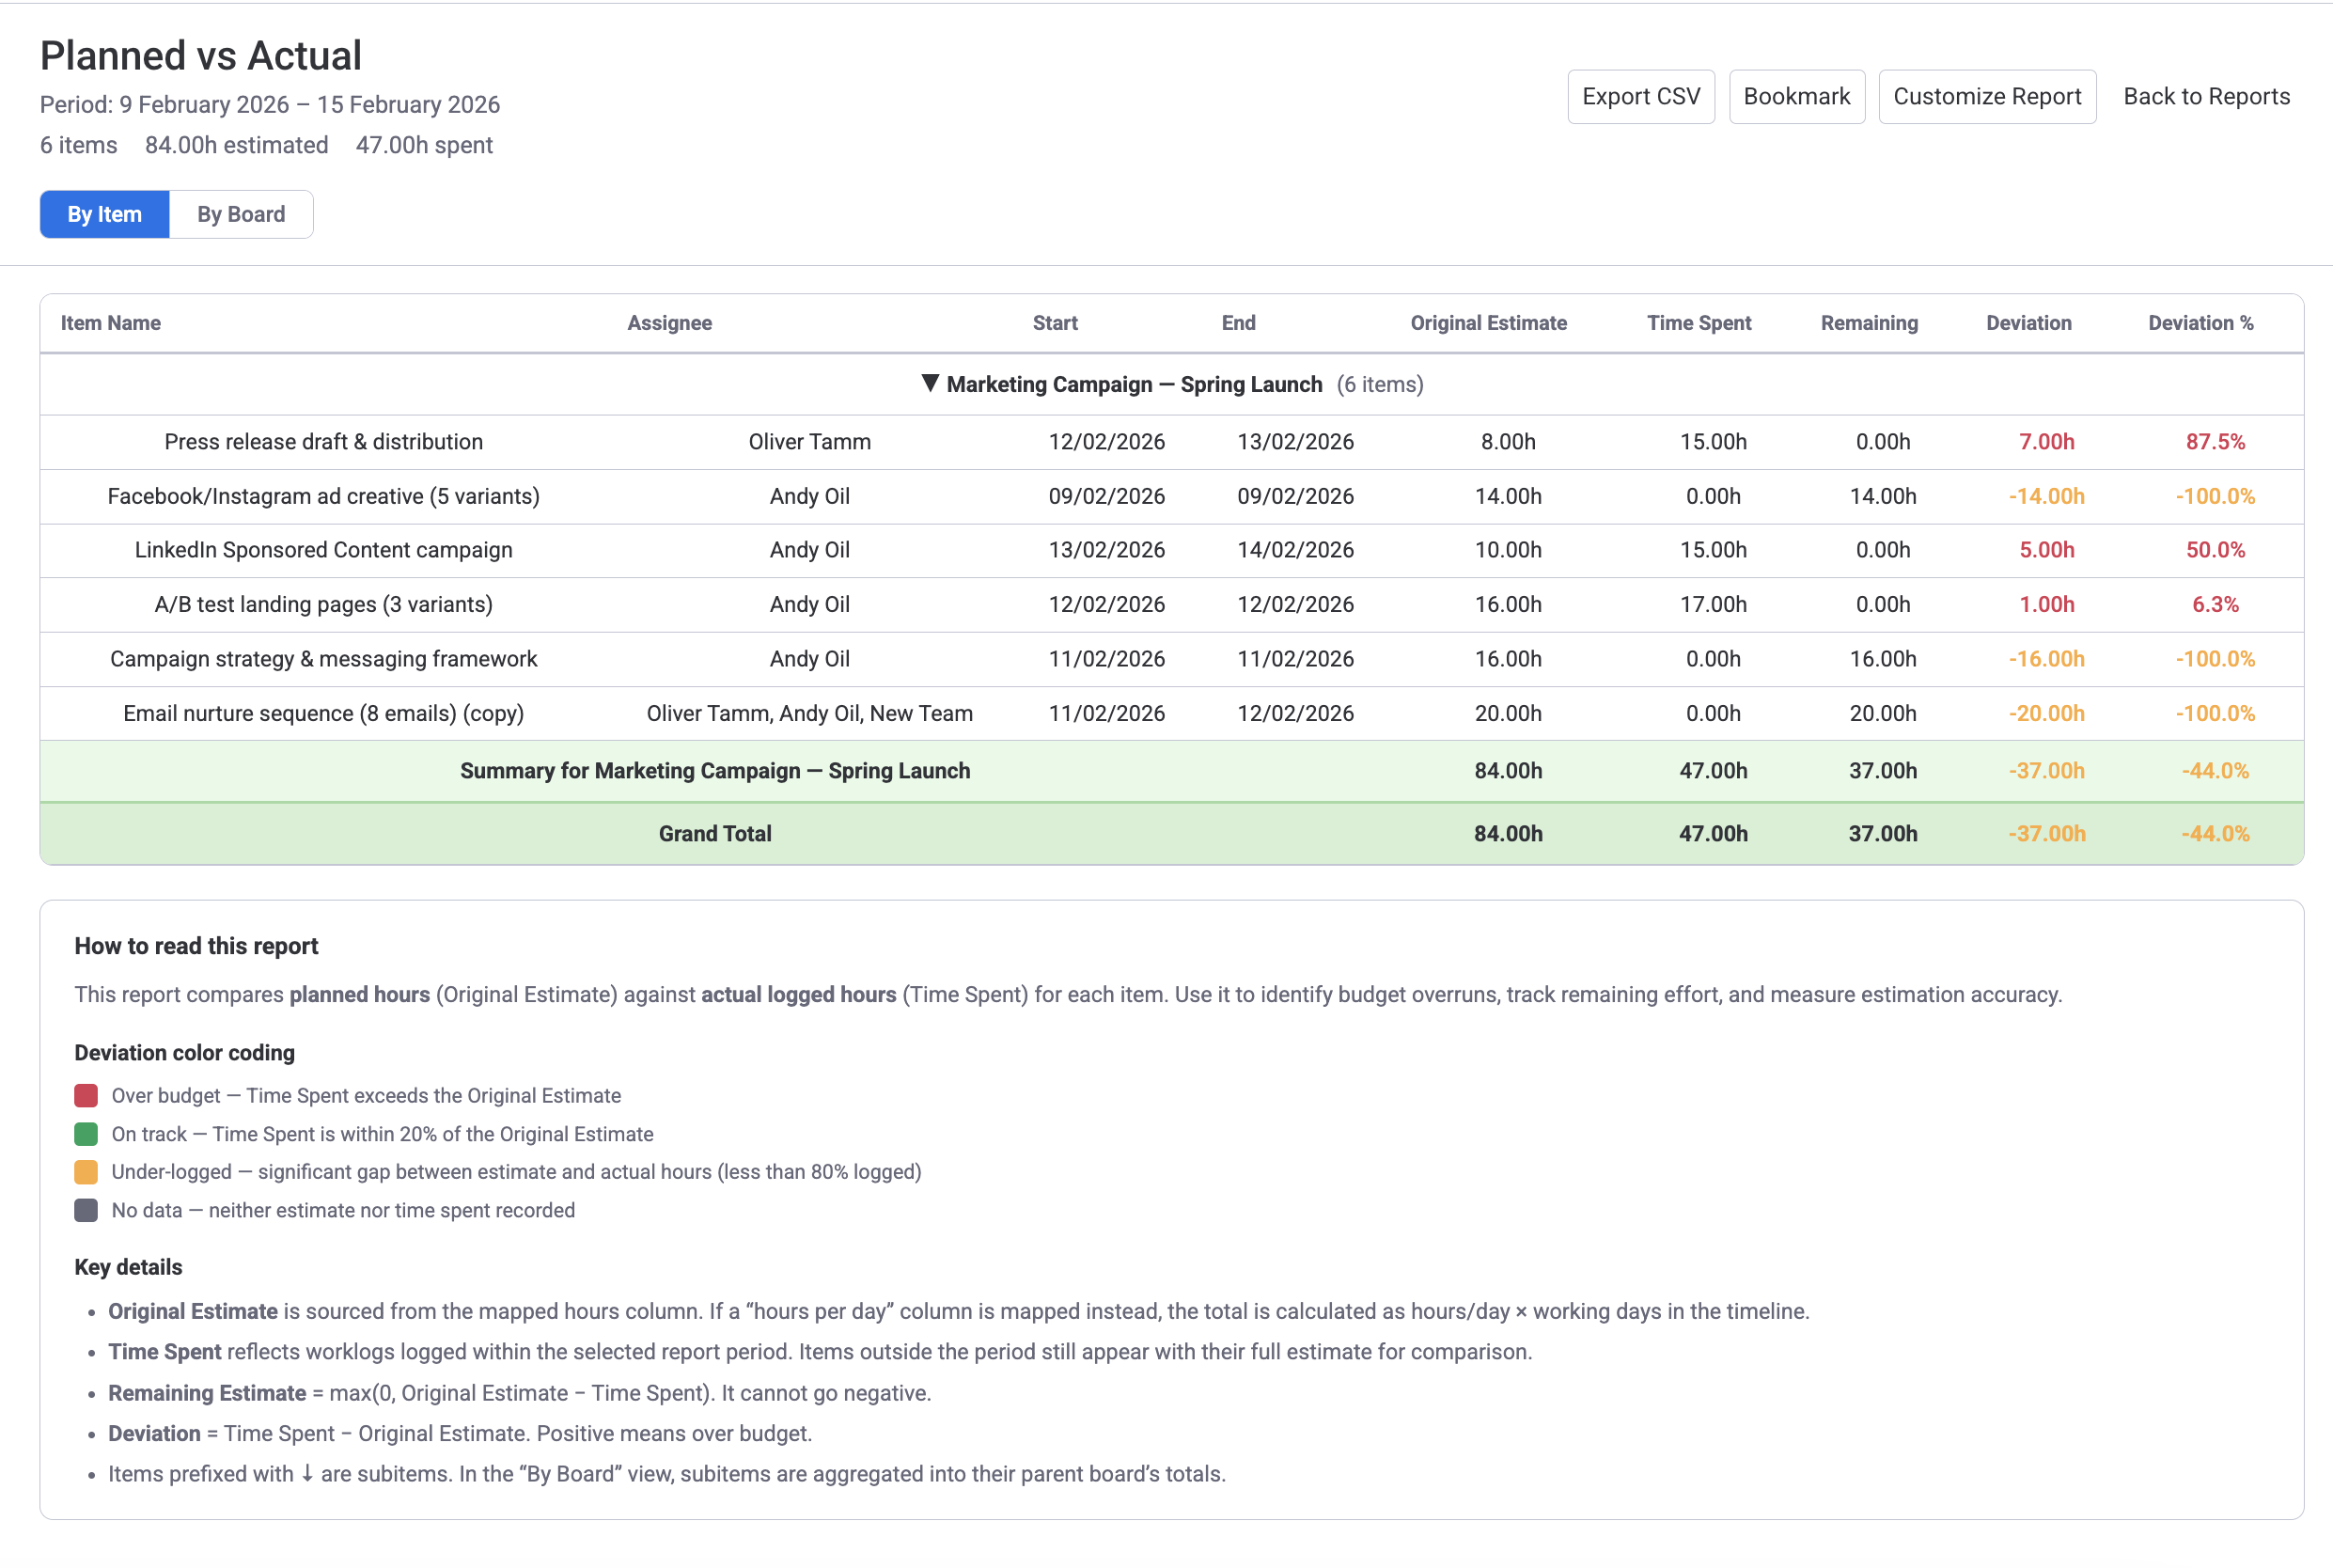
The Planned vs Actual report compares the Original Estimate (planned hours from the mapped hours column) with Time Spent (sum of worklogs for the selected period). It calculates remaining effort and deviation so you can see where projects are on track, over budget, or under-logged.
Two views
- By Item — each row is an individual item or subitem, grouped by board with per-board summary rows.
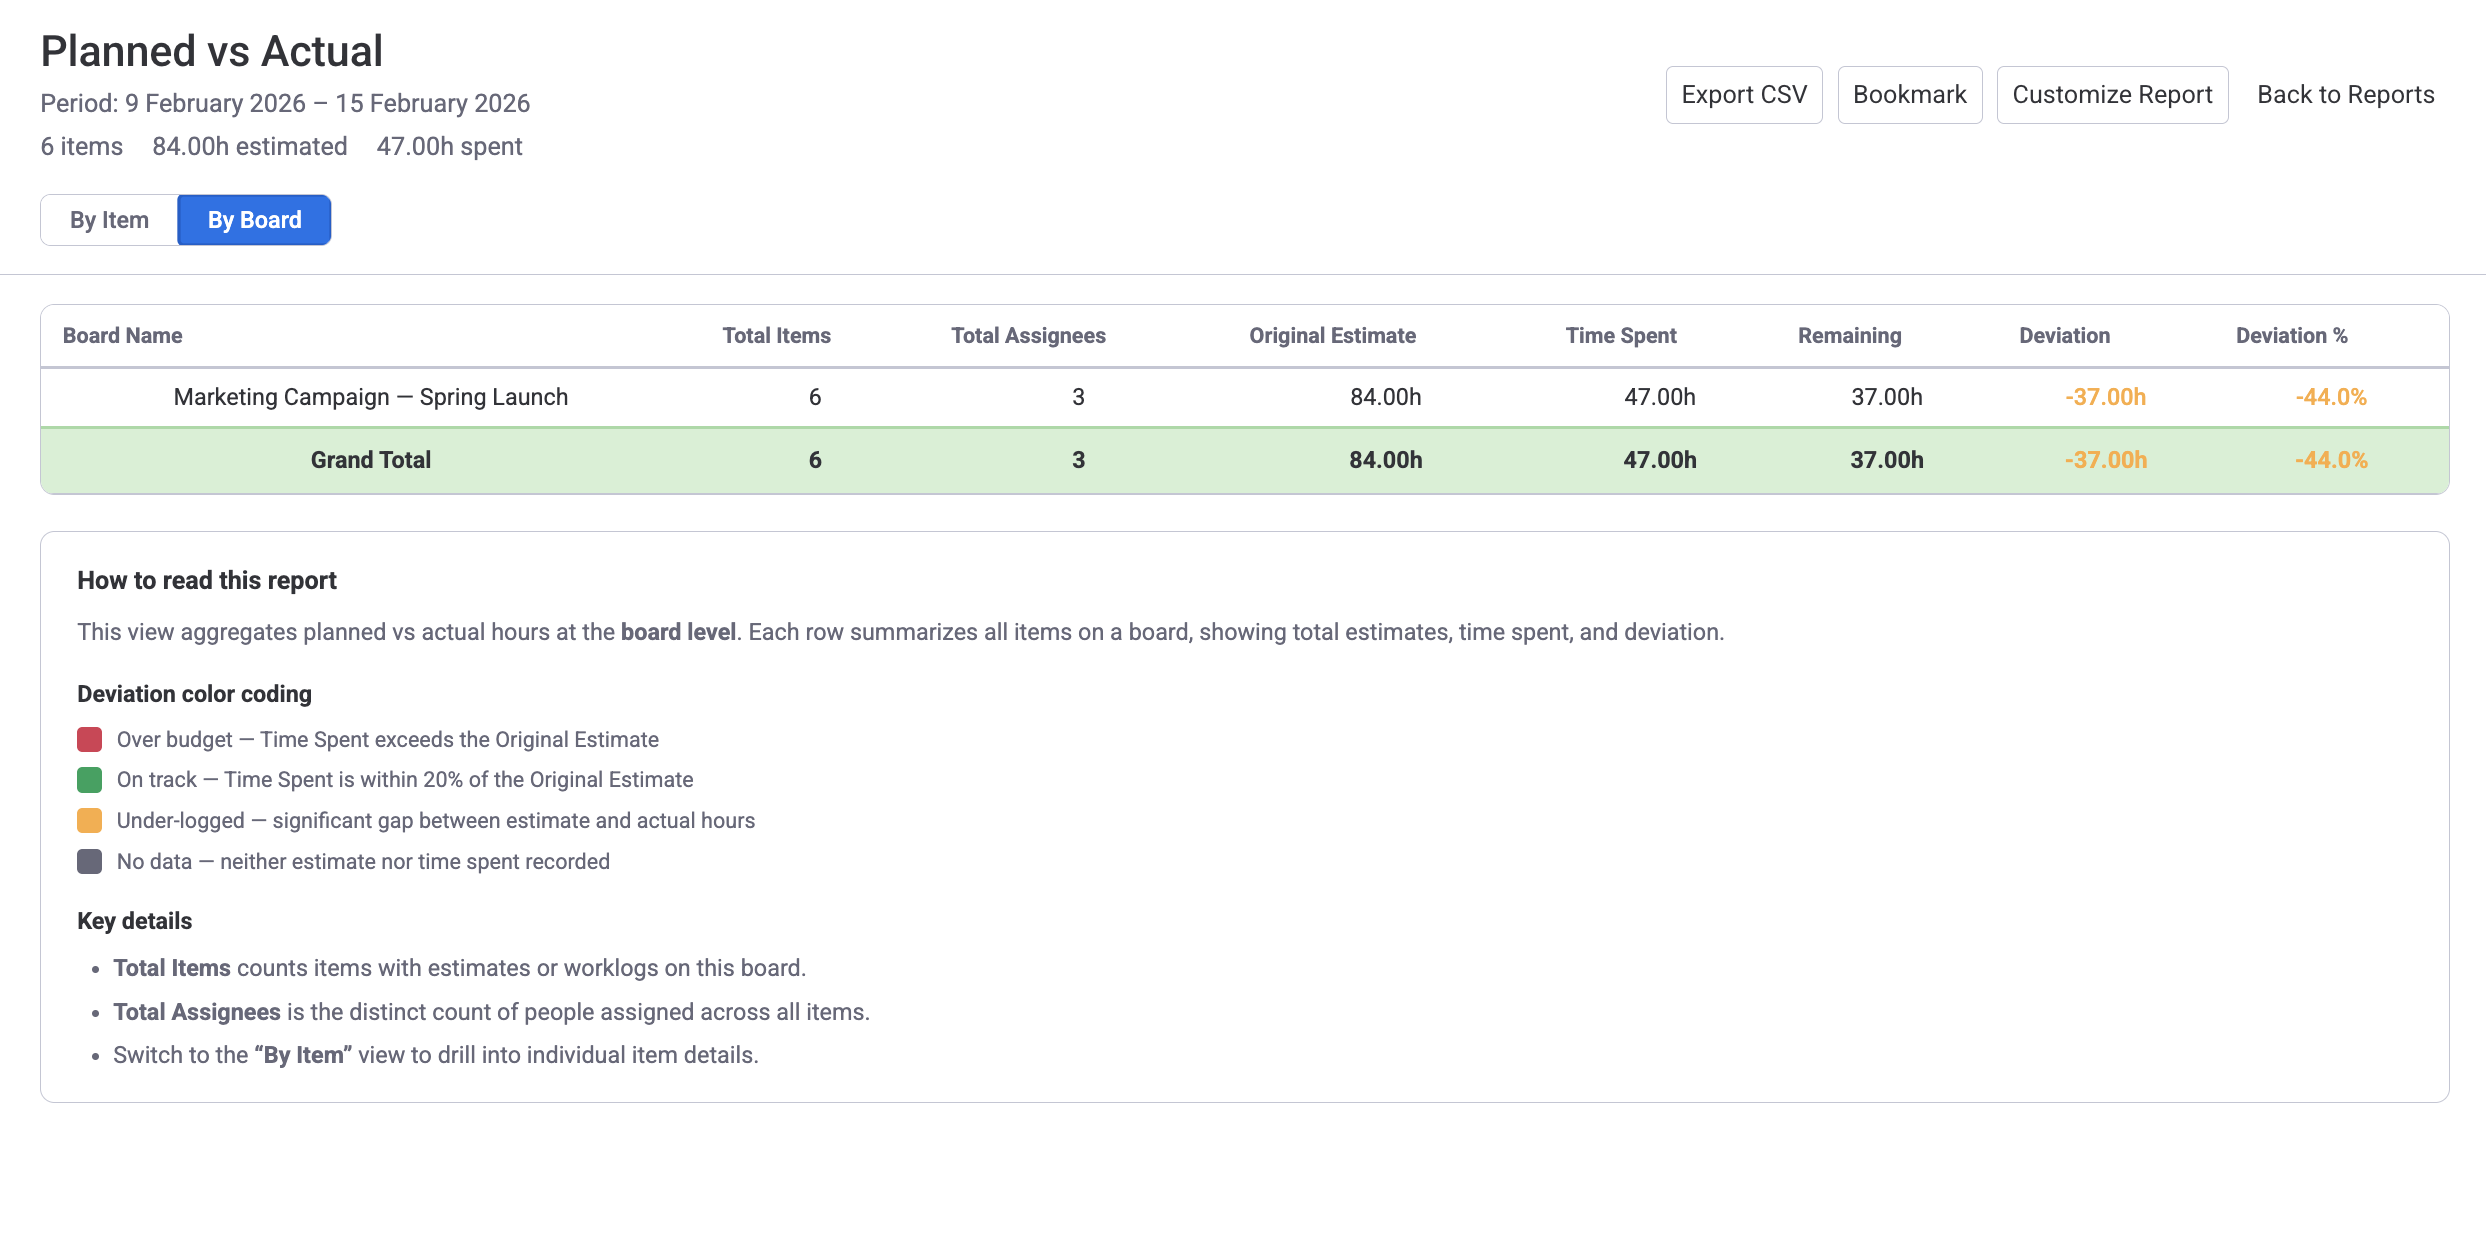
- By Board — each row is a board, aggregating all items into totals for a high-level overview.
Key columns (By Item view)
| Column | What it shows |
|---|---|
| Item Name | The monday.com item name. Subitems are indented. |
| Assignee | People assigned to the item. |
| Start / End | Timeline dates from the mapped Timeline column. |
| Original Estimate | Planned hours from the mapped hours column. |
| Time Spent | Sum of worklogs for this item within the selected period. |
| Remaining | Original Estimate minus Time Spent (minimum 0). |
| Deviation | Time Spent minus Original Estimate. A positive number means over budget. |
| Deviation % | (Deviation / Original Estimate) x 100. |
Deviation color coding
| Color | Meaning |
|---|---|
| Red | Over budget — Time Spent exceeds the Original Estimate. |
| Green | On track — Time Spent is within 20% of the Original Estimate. |
| Yellow | Under-logged — a large gap between estimate and actual hours. |
| Gray | No data — neither estimate nor time spent recorded. |
Use cases
- Sprint retrospectives — compare planned vs actual across a sprint to improve future estimates.
- Budget tracking — spot items where actual hours far exceed estimates (scope creep).
- Team calibration — identify who consistently over- or under-estimates.
Creating Reports
Follow these steps to generate a report:
Choose a template
In the Report Templates tab, click the card for the report you want.
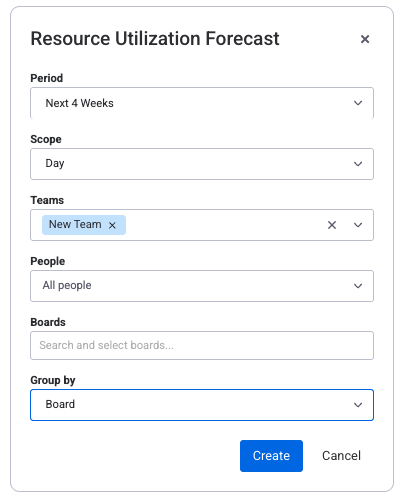
Configure parameters
A dialog opens with the filters available for that report type:
- Period — pick a preset range or choose Custom Range with specific dates.
- Scope — date column granularity: Day, Week, or Month (not available for the Detailed Worklog).
- Teams — filter by monday.com teams.
- People — filter by specific team members.
- Boards — select boards to include. Leave empty for Utilization and Board Resources to include all configured boards (up to 100). At least one board is required for Planned vs Actual.
- View — By Item or By Board (Planned vs Actual only).
- Group by — None, Team, Board, or Item (Utilization Forecast only).
Generate the report
Click Create. Results appear in a table. You can reconfigure from the toolbar without starting over.
Bookmarking Reports
After generating a report you can bookmark its configuration so you can re-run it later with a single click.
Save the bookmark
Click the Bookmark button in the report toolbar.
Name it
Enter a descriptive name (up to 200 characters) and confirm.
Re-run anytime
Go to the Bookmarked Reports tab and click any bookmark to regenerate it instantly. You can also delete bookmarks you no longer need.
Exporting to Excel
Every report supports Excel export for offline analysis, sharing with stakeholders, or archival.
| Detail | Description |
|---|---|
| Format | Excel (.xlsx). Opens in Excel, Google Sheets, or any spreadsheet app. |
| Contents | All visible columns including summaries and date columns. Sub-rows (per-board or per-person) are included as indented rows. |
| Delivery | Downloaded immediately to your browser's default download location. |
| Filename | Auto-generated from the report type, scope, and date range, for example utilization_weekly_report_2026-01-01_2026-03-31.xlsx. |
Click the Export button in the report toolbar to download. If filters are applied, only the filtered data is exported.
Report toolbar
After generating a report the toolbar provides these actions:
- Export — download the report as Excel.
- Bookmark — save the configuration for quick re-use.
- Reconfigure — re-open the configuration dialog to adjust filters and regenerate.
- Back to Reports — return to the gallery.
Related Pages
- Resource Scheduler — schedule and assign work that feeds into utilization and allocation reports
- Time Tracking — log worklogs that appear in the Detailed Worklog and Planned vs Actual reports
- Workload Management — real-time workload view that complements report data