Toolbar & Navigation Back to top
The toolbar at the top of the page provides all controls for navigating and configuring your timeline view.

Toolbar Controls
- Team Switcher (left side) — select which team to display (e.g., "Main Team")
- Date Navigation — use the < and > arrows to move backward/forward, or click Today to jump to the current date
- View Scope — toggle between Week, Month, Year, and Year Monthly
- Filter — filter bookings by work target type (All Types, Project, Epic, Issue, Custom Category)
- + Create Booking — open the booking creation dialog
- Bulk Allocate — open the bulk allocation dialog
- Settings (gear icon) — access Capacity Settings and Manage Categories
Month View Back to top
The Month view displays one month at a time with each day as a column and each team member as a row. This is the default view and is ideal for day-by-day resource planning.
- Each row represents a team member (with avatar and name)
- Each column represents a single day
- Bookings appear as colored horizontal bars spanning their date range
- The today column is highlighted for quick orientation
- Hours per day are shown as badges on booking bars (e.g., "8h")
- The color legend at the bottom maps colors to work target names
Year Monthly View Back to top
The Year Monthly view shows an entire year at a glance, with each column representing a month and rows for team members. This view is ideal for long-term capacity planning and identifying resource gaps across quarters.
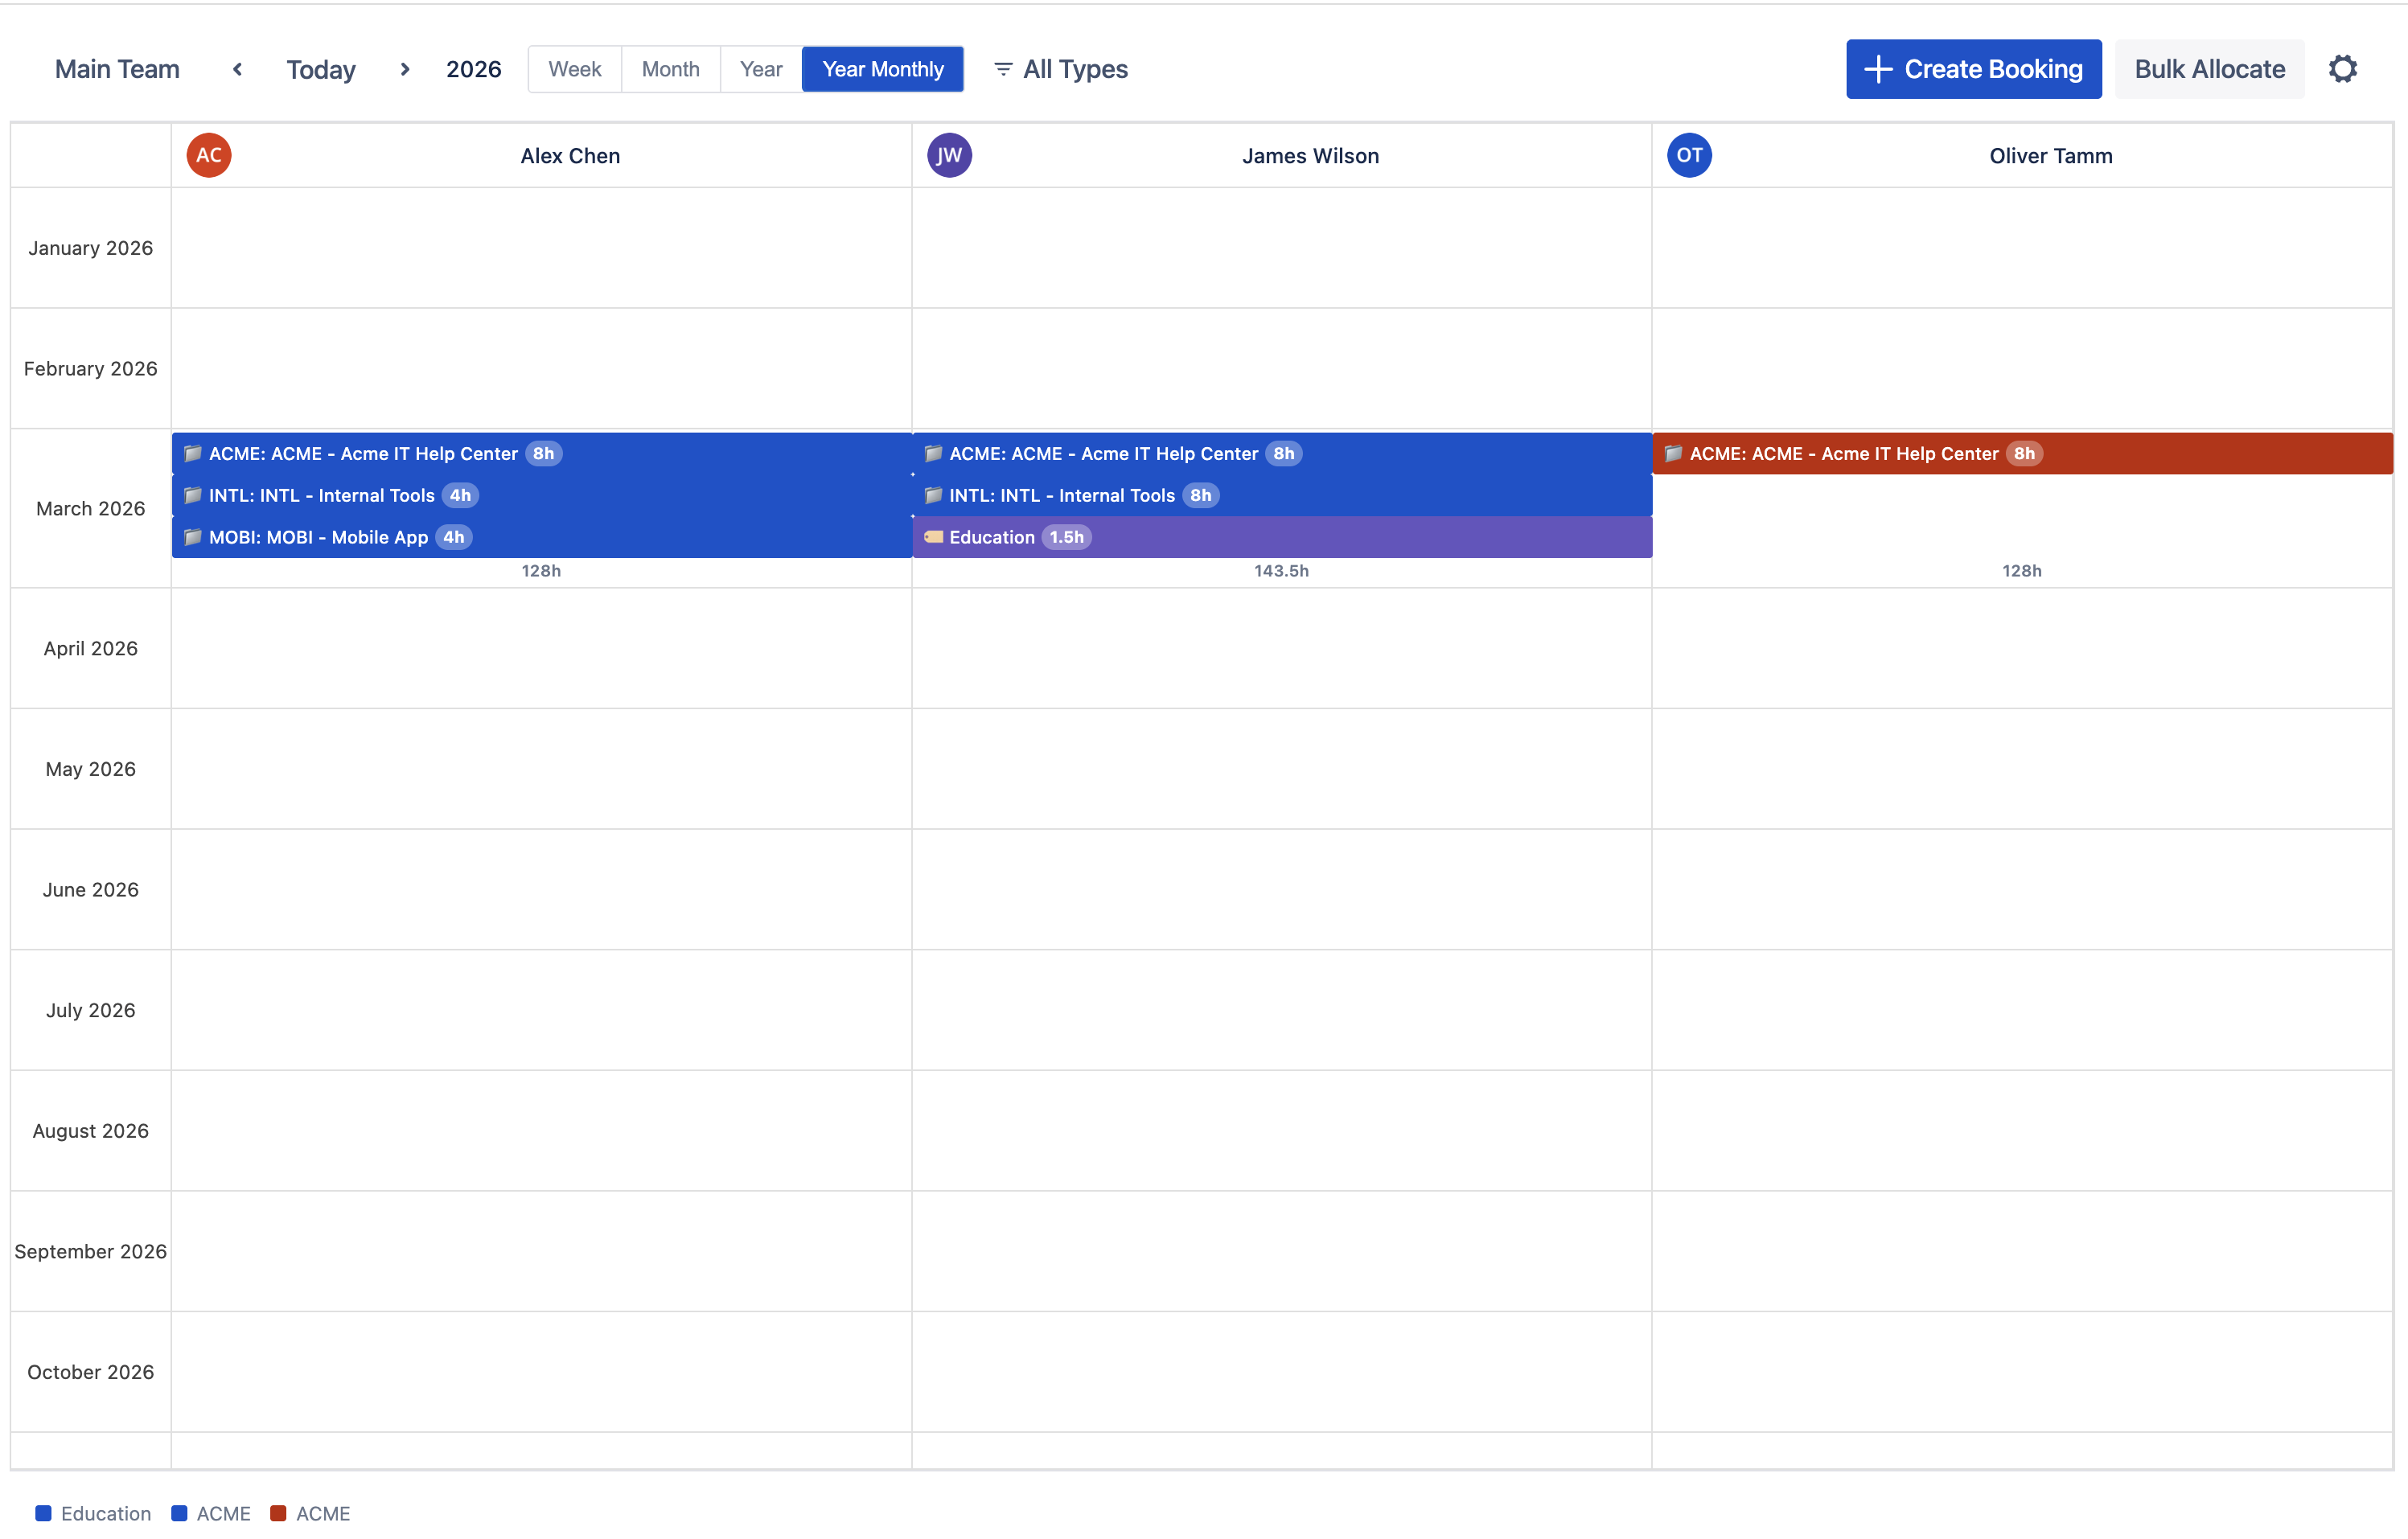
- Columns represent months (January through December)
- Booking bars span across months to show long-term allocations
- Total hours per user per month are displayed below bookings (e.g., "136h")
- Multiple bookings per user per month are shown as stacked bars
Additional View Scopes
Besides Month and Year Monthly, the app also offers Week view (7-day granularity) and Year view (daily columns for an entire year). Use the view scope toggle in the toolbar to switch.
Reading the Grid Back to top
Each cell in the grid represents one user for one time unit (day, week, or month depending on the selected view scope).
- Colored bars represent active bookings. The bar color corresponds to the work target.
- Bar labels show the project key, project name, and hours per day (e.g., "ACME: ACME – Acme IT Help Center 8h").
- When a user has multiple bookings on the same period, bars are stacked vertically.
- Hours badges on each bar indicate the allocated hours per day.
- The color legend at the bottom of the timeline maps each color to its work target name.
Filtering Back to top
Use the filter dropdown in the toolbar to narrow down which bookings are displayed on the timeline.
- All Types — show all bookings (default)
- Project — show only project-level bookings
- Epic — show only epic-level bookings
- Issue — show only issue-level bookings
- Custom Category — show only custom category bookings
Filtering does not delete or modify bookings — it only controls which ones are visible on the current view.
Need Help?
If you have questions or need assistance, our support team is here to help.
Contact Support